


Channel Islands Biodiversity Groups
When you compare species composition among sites, our 21 island sites separate out into three distinct groups. What is the driving force behind these biodiversity patterns? We looked at sea surface temperature, rock type, bathymetry, wave exposure, slope of bench, and the island on which a site was located. Preliminary results suggest that, the only factor that is consistant with the grouping pattern found by the cluster analysis was water temperature.
- The cold group represented by blue circles is made up of San Miguel Island, San Nicolas Island, Santa Rosa Island, the west end of Santa Cruz Island, and Frenchy's Cove on Anacapa Island.
- The mixed group represented by purple circles is made up of Santa Barbara Island, the east end of Santa Cruz Island and Middle on Anacapa Island.
- The warm group represented by red circles is the two sites on Santa Catalina Island.
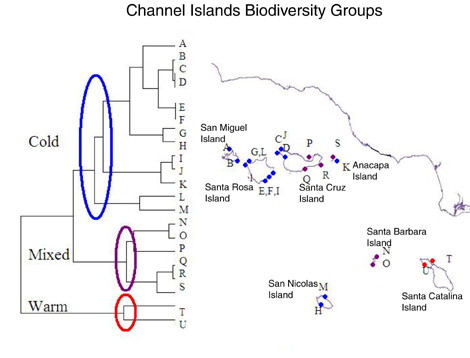
A- Crook Point SMI, B- Cuyler Harbor, SMI, C- Fraser Point SCI, D- Trailer SCI, E- Johnson's Lee SRI, F- Ford Point SRI, G- Fossil Reef SCI, H - Marker Poles SNI, I- East Point SRI, J- Forney SCI, K - Frenchy's Cove AI, L- NW Talcott SRI, M- Thousand Springs SNI, N- Landing Cove SBI, O-Sea Lion Rookery SBI, P- Prisoners SCI, Q- Willows SCI, R- Valley SCI, S- Middle AI, T- Bird Rock CI, U- Little Harbor CI
Channel Islands Water Temperatures
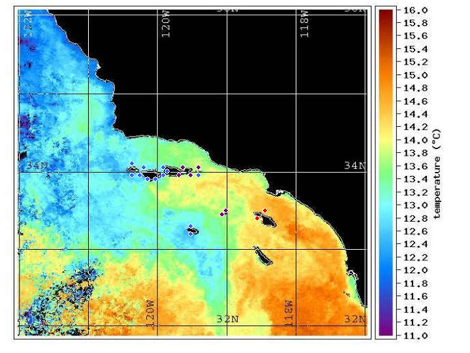
Water temperature appears to be the driving force behind the biodiversity patterns seen on the Channel Islands. Islands that are continuously bathed by the cool California Current are represented by blue dots on the above map and the water around these sites is cooler than other sites within the Channel Islands. Sites denoted by purple have mixed current temperature. Part of the year the waters around these islands are cool while other times they are warm. The two sites on Santa Catalina Island in red are continuously bathed by the California Counter Current and have a much warmer ocean temperature.
Water temperature appears to play a significant role in biodiversity patterns at sites on the Channel Islands. The water temperature varies as little as one degree Celsius between cold and mixed sites. The affects of global warming may be reflected by changes in species composition found within the intertidal.
The map below shows the water temperature
around the Channel Islands on 31 August 2003 (Sea Surface Temperature image courtesy NOAA).
Biodiversity Patterns within the Channel Islands
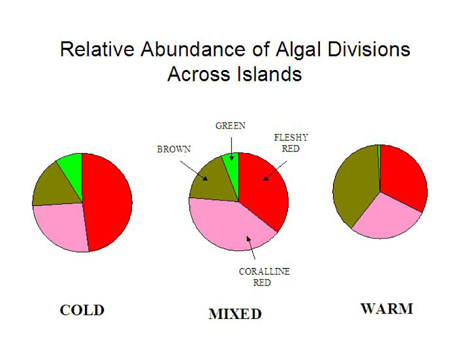
The biodiversity patterns were determined by comparing species composition between sites. The following analysis looks at why sites separate into three distinct groups. The relative abundance of both algae and invertebrate taxa varies greatly among the three temperature groups.Fleshy red algae make up half of the algae found at cold-water sites, while coralline red algae make up a quarter of the algae found at cold- water sites. Brown and green algae make up the final quarter of algae found at cold- water sites. At mixed- water sites, brown and green algae continue to make up a quarter of the algae found at a site, but the relative abundance of red algae is more evenly distributed between coralline reds and fleshy reds. As you move to warm- water sites, the relative abundance of red algae remains evenly distributed between coralline reds and fleshy reds, but there is a dramatic increase of brown algae.
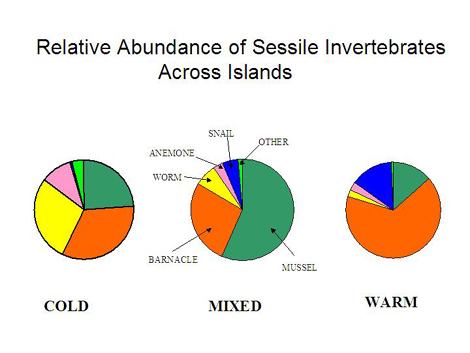
The relative abundance of sessile invertebrates also varies among the three groups. At cold- water sites, the composition of invertebrate community is comprised mostly by mussels (green), barnacles (orange), and colonial worms (yellow). In contrast, the community at the mixed- water sites is dominated by mussels (green), and at the warm- water sites by barnacles (yellow).
BACK to top of page.