


Cladogram of Biogeographic Patterns
Biodiversity patterns were based on the results of a cluster analysis using the Bray Curtis Similarity Index to look for similarities/differences among sites. The biogeographic groups were determined by the clustering patterns of the cladogram. The colored circles on the chart below represent different biogeographic groups, which are also shown on the map.
Note that some sites in the middle of the diagram that
are not circled into groupings. These sites are each a sort of
anomaly compared with the larger groupings. The reasons for their
differences are not completely understood, but appear to be related to
either:
1. Geographic characteristics; Mussel Flat is located on the
remote and isolated Southeast Farallon Island; Lucia and
Partington Point are both very steep, short and exposed benches or,
2. Sand scouring influence, evident at Sandhill and
Terrace Point
Click on the diagram below for a full scale view.
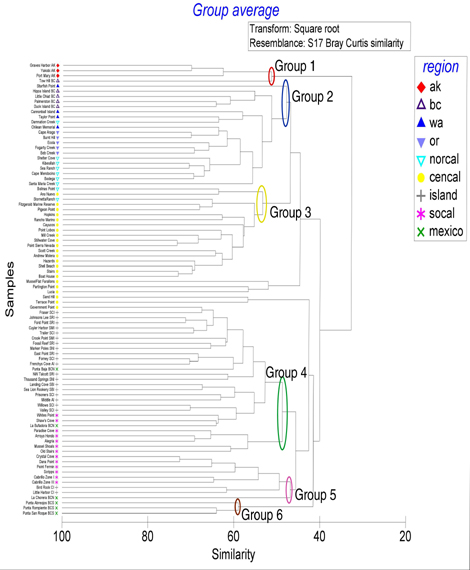
The cladogram above shows the degree of relatedness between sites based on species composition and abundance. One can think of a cladogram like a family tree. Sites closer together on the tree are more similar in species composition and/or relative abundance than sites that are further apart. For example, sites found in the blue cluster are more similar to each other than they are to sites found in the purple or green clusters.
The length of the branch is also important when comparing sites. The shorter the branch, the more similar the species composition. For example, within the blue cluster the British Columbia sites have a species composition more similar to each other than to other sites in Washington, Oregon, or Northern California. There is a high degree of structure found within each branch. The structure of the Channel Islands is examined in more detail at Channel Islands Biodiversity.